Taylor Günther · 28 October 2026
Artists Showcase Shifting Shorelines in Temporary Displays as Offshore Energy Plans Advance
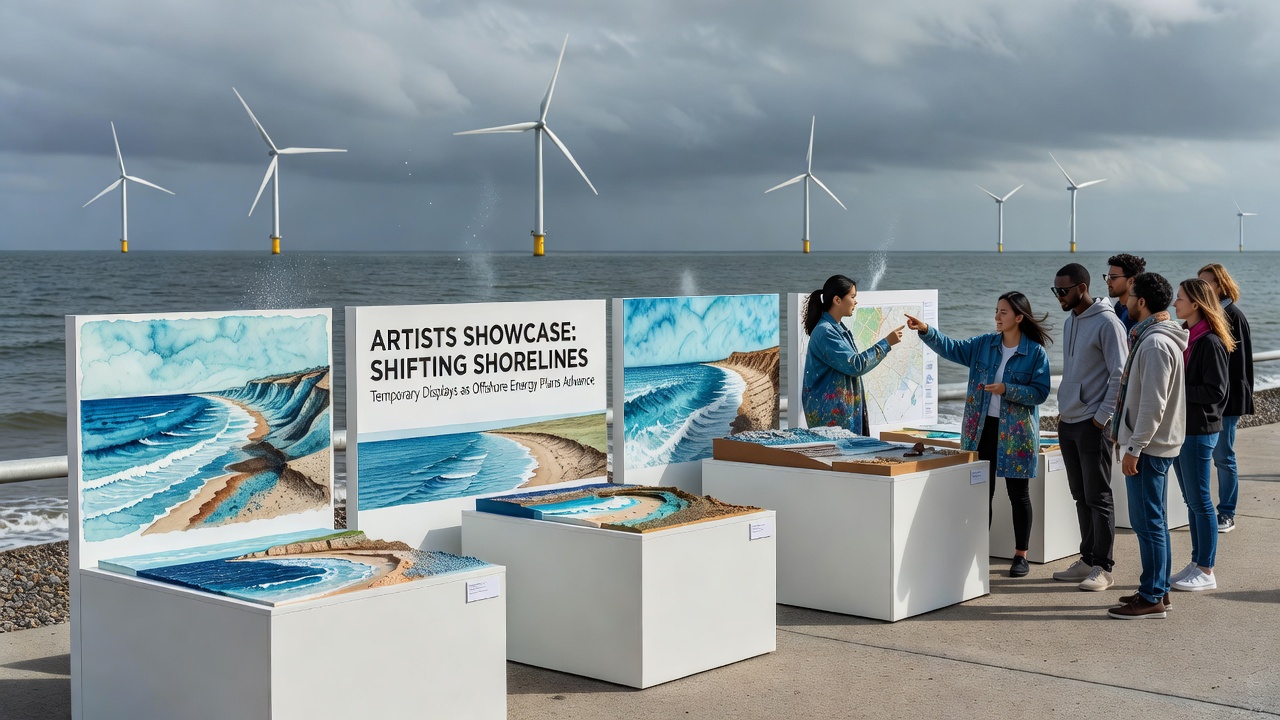
Coastal communities have watched shoreline positions move in measurable ways over recent decades, and artists in several regions now respond with temporary displays that map those changes against expanding offshore energy infrastructure. Data from monitoring programs show sediment transport patterns shifting as turbine arrays alter wave dynamics, and these observations feed directly into the installations that appear each season.
Documenting Coastal Changes Through Art Installations
Observers note that temporary exhibits often incorporate real-time data on tidal reach and beach profile measurements collected by regional environmental agencies. In one series mounted along access paths, panels printed with elevation contours from 2015 surveys sit beside updated 2025 readings so viewers can trace the difference in a single glance. Researchers from coastal geology programs supply the underlying figures while artists handle the physical placement and lighting that makes the comparisons visible after dark.
These displays operate on short cycles, usually four to six weeks, because permitting for public land use limits longer occupancy. Organizers coordinate with local authorities to remove materials before seasonal storms arrive, which keeps the sites clear and prevents debris issues that could affect navigation near planned cable landing points for offshore wind projects.
Offshore Energy Expansion Timelines
Offshore energy plans continue to move forward on schedules set by federal leasing rounds, with several lease areas scheduled for construction milestones in late 2026. Transmission route approvals published by the Bureau of Ocean Energy Management list interconnection points that cross current intertidal zones, and those routes have prompted additional baseline surveys of nearshore bathymetry. Artists reference the same survey coordinates when positioning their works so the installations align with the areas under active review.
Materials and Methods in Temporary Shoreline Exhibits
Creators select materials that withstand salt exposure yet break down or recycle easily once the display period ends. Recycled aluminum frames hold printed fabric or translucent films treated with UV-resistant coatings, while solar-powered LED strips provide nighttime visibility without requiring grid connections. One installation used tide-activated sensors that changed color intensity according to water salinity readings taken at fixed monitoring stations, linking the visual effect to oceanographic records maintained by the National Oceanic and Atmospheric Administration.
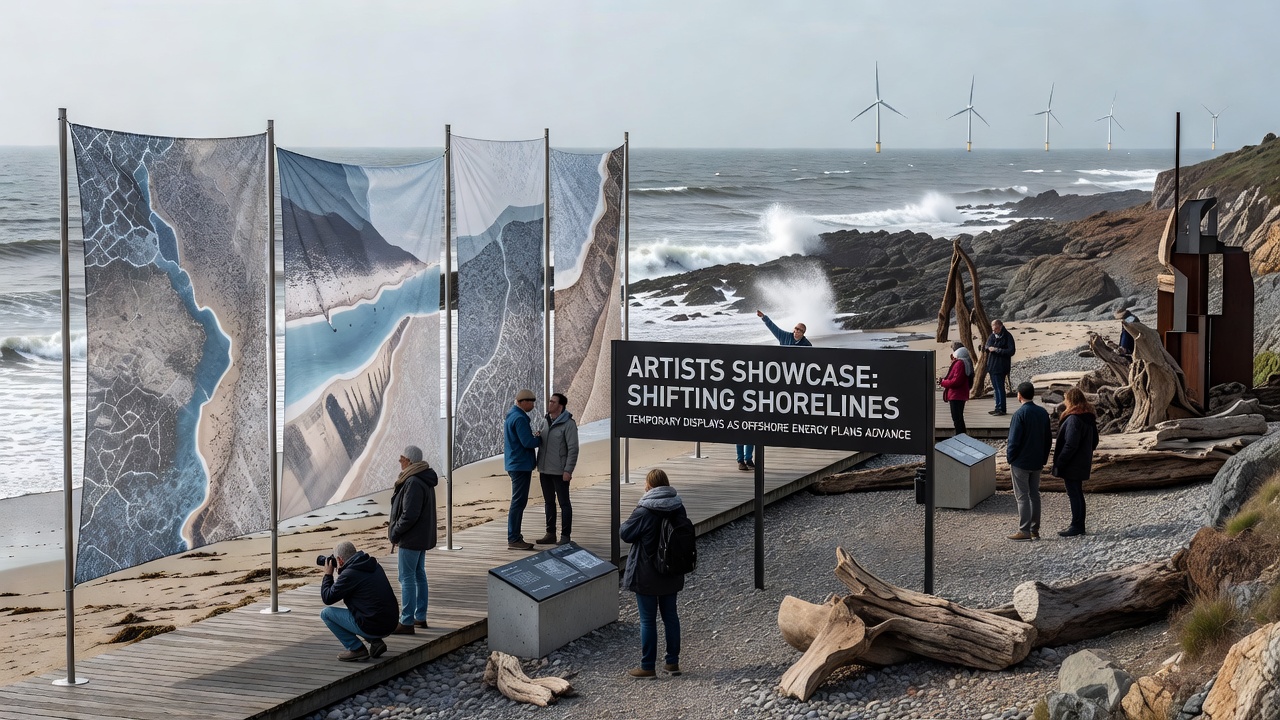
Placement strategies avoid sensitive nesting areas and follow guidelines issued by wildlife management offices. Volunteers document visitor counts and foot traffic patterns during the exhibition windows, then share summaries with planning departments that track cumulative impacts on public access points ahead of cable burial operations scheduled to begin after October 2026.
Community Access and Data Integration
Local libraries host accompanying digital archives that allow residents to examine the full datasets used in the displays. These archives pull from open repositories maintained by state coastal programs and university research groups studying sediment budgets around energy infrastructure corridors. Attendance records indicate steady foot traffic during evening hours, particularly on weekends when interpretive sessions explain how bathymetric shifts recorded by multibeam sonar connect to turbine foundation designs.
Exhibition organizers report that the temporary nature of the works encourages repeated visits because each cycle introduces new measurement sets from the most recent survey season. This approach keeps the content current with ongoing environmental assessments required under project permitting processes.
Conclusion
Temporary shoreline displays continue to function as visual interfaces between collected environmental data and public awareness of offshore energy development timelines. As construction phases advance toward 2026 milestones, the exhibits supply updated snapshots drawn from the same monitoring networks that inform regulatory reviews, giving communities repeated opportunities to examine shoreline metrics alongside planned infrastructure routes.